Late last year, the Department for Levelling Up, Housing and Communities (DLUHC) announced a new round of the Local Digital Fund, and in March, we were awarded funding for a digital project to improve hospital discharges to social care.
What problem are we trying to solve?
As in other parts of the country, we face challenges when trying to discharge people from hospitals. Age UK has calculated that, across the country, millions of bed days are lost due to delays in the transfer of care. Improving the discharge process would significantly benefit often frail patients and also reduce pressure on limited health and social care budgets.
With an ageing population, the number of people requiring treatment and support to leave hospitals continues to increase, and it can be difficult to assess exactly how much capacity and demand there is in the health and social care system at any one time.
Our successful bid to the Local Digital Fund was for a Discovery project to explore if we can use data to help improve our understanding of patient/client flow and improve patient outcomes. Through the discovery, we aimed to determine if there is a problem that can be solved, identify a digital solution, and begin the development of a prototype.
Another key project component is to see if we can develop something useful for other local authorities. We have used previous Local Digital awards to build our Family Context tool in a way other authorities can replicate.
What progress are we making?
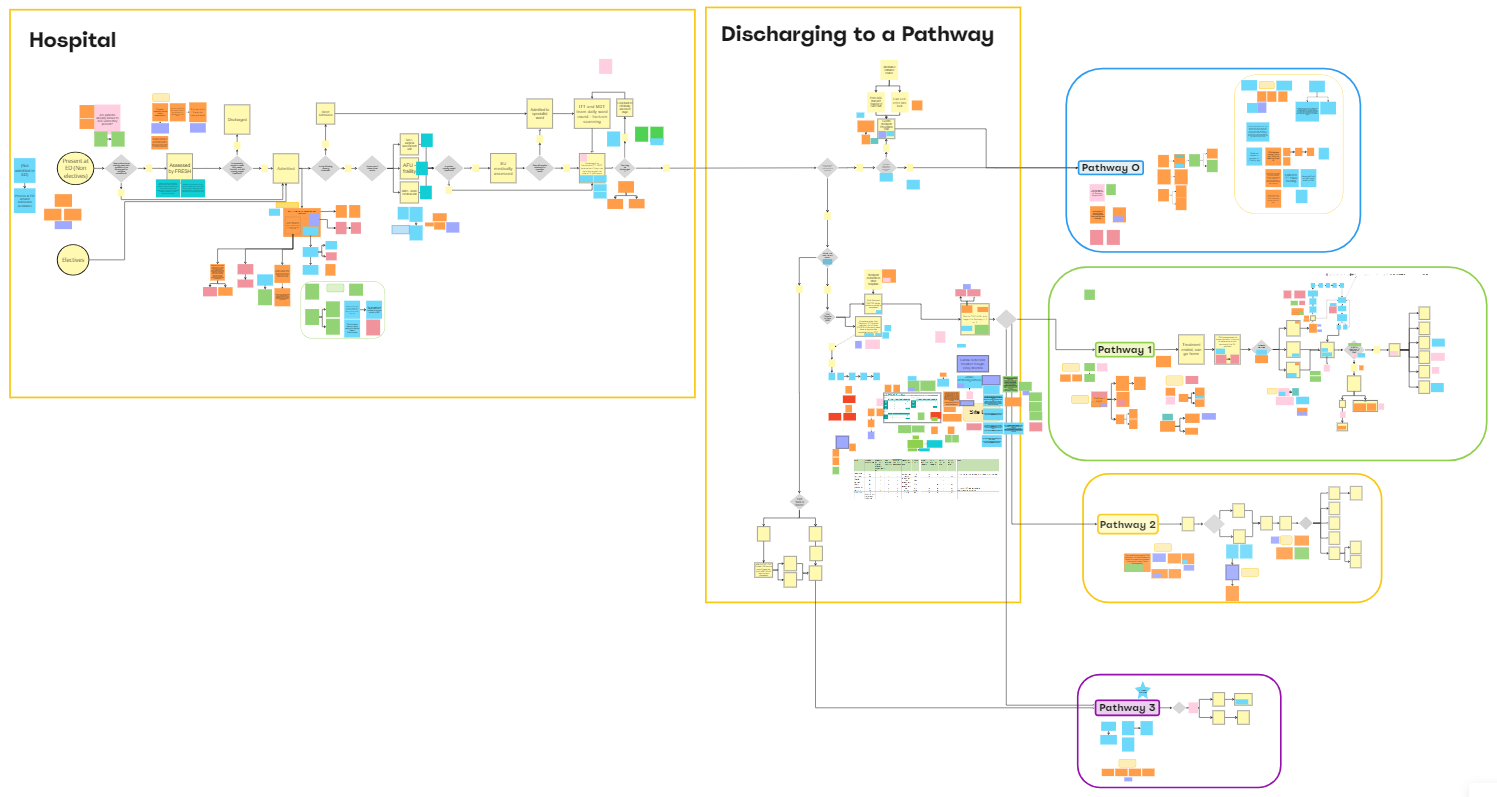
We have run a number of workshops to help understand the process in more detail. The workshops included colleagues from the health and social care system and other teams such as Business Intelligence. We have also included colleagues from Manchester and Oldham councils to see how similar their process is and if we can develop a common solution.
As part of this, we identified strengths and weaknesses in terms of data availability at each part of the process. We confirmed the source of the data, the owner, how often the data is refreshed, and the granularity (aggregate or patient/client level) and assessed data quality. We also identified various ‘pain points’ where we should focus. Essentially which parts of the process where we could add the most value, the quickest.

Image: Process mapping
Following discussions, we focused on improving the available data at four discharge locations: Abney Court, Bruce Lodge, Bramhall Manor and Bluebell. We felt this was the area where we could make the biggest difference. The plan is to develop a digital method to easily capture the relevant information, with a linked interactive dashboard that will provide daily updates in terms of bed capacity, plans for discharge and any reasons for the delay. The dashboard would be available for decision-makers across the health and social care system.
Taking an agile, iterative approach, we are developing a new online method for capturing data from the four locations and have also developed a prototype dashboard to summarise the data. The dashboard provides insight showing the latest capacity, average length of stay, reasons for delays and planned actions. It’s possible to break this down by location or look at the information for Stockport as a whole. It is also possible to drill down to individual beds, with any patient/client information removed, so identifying individuals is impossible.

Image: Prototype dashboard (dummy data)
What is next?
We are in the process of amending the data capture process and dashboard based on feedback from colleagues. We are currently capturing the data twice a week, but we are looking to switch to daily updates. Capturing data each day will help us spot any data quality issues earlier and provide decision-makers with up-to-date information. We are also looking to address data quality issues we’ve identified as part of the prototype development.
We are automating the process for archiving the data. The archived data will provide a bed capacity and flow history, allowing us to look at trends and seasonal patterns, which should be useful for longer-term planning
We also want to capture additional data from each location to provide further details on the reasons for any delayed discharge. Currently, the data we receive is difficult to present visually, so we are looking to include a series of flags, making it easier to identify themes when looking at the data.
Finally, we are planning further sessions with colleagues in Manchester and Oldham to see how useful the prototype would be for other local authorities.
Read the next blog on this project, which has more information on our progress.
Sign up for email alerts for regular updates from the #DigitalStockport blog.

